You have a lot of customer data in your Zendesk… so now what? Unless you know how to use that data to improve your business, it’s meaningless. At Zendesk, we spend a lot of time thinking about ways to relate your customer interaction data back to your organization’s bottom line. Here are 5 tips to help you start using your customer data to change your company for the better.
Tip 1: Capture customer segment data When a key metric, like customer satisfaction, starts to lag, it’s obvious you need to change something. But what? Slicing key metrics by customer segment allows you to pinpoint the source of the problem and make targeted improvements for those customers. Much easier than trying to raise the metric across the entire customer base!
You can segment customers based on which products they own, their geography, or the history of their interactions—as long as the segment is defined by some important trait that could make customers behave differently from the baseline.
At Zendesk, we capture customer segments in custom organization fields. This approach lets us bring data like the customer’s plan type and help desk size into Zendesk Insights, where we can monitor metrics like customer satisfaction, time to first reply, and Net Promoter Score (NPS) across our most important customer segments. When one segment begins to fall behind in performance, it’s a clue about what questions to ask next.
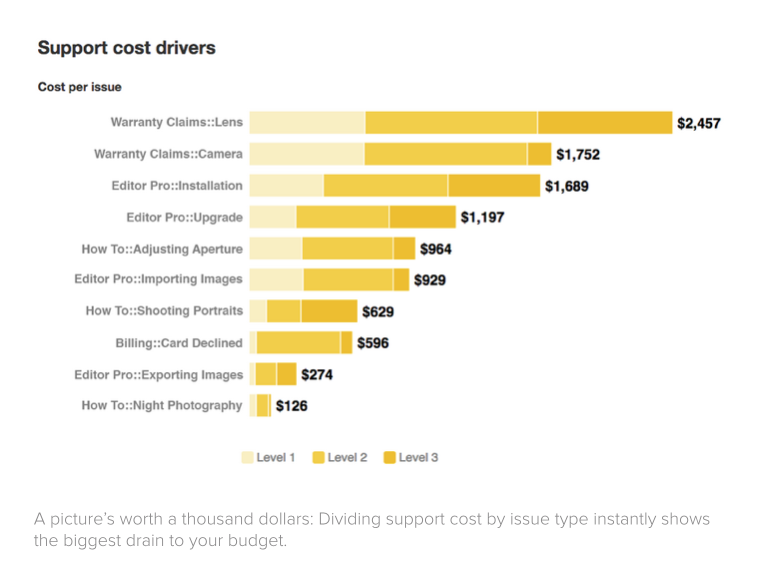
Tip 2: Track the issues driving customer interactions Tracking segments allows you to locate where a problem lies. Tracking the issues customers contact you about is your key to knowing what to do about them. When you know what type of issues are associated with poor satisfaction ratings, long response times, or bad Twitter publicity, you know which part of the customer experience needs to change. Look at metrics tied to the problematic issue broken down by segment, and you know for whom it needs to change as well.
Issue types can refer to a product with which the customer needs support (say a camera lens model number), a process stage the customer is stuck on (like downloading the latest software update), or a shortcoming in your product or service customers want improved (perhaps a settings menu that is difficult to navigate).
It seems simple, but accurately capturing the topic of each interaction helps you quantify the scale of any problem. At Zendesk, we use a custom ticket field called About to categorize the reason for the customer’s outreach. This data is a valuable resource for everyone: our product organization uses it to prioritize bug fixes, our marketing team uses it to create more relevant content, and our sales team uses it to provide better advice on how to set up your Zendesk.
Tip 3: Include metrics the whole company cares about Alright—your segment data is telling you which customers need more help, and your issue data is telling you where they need help. Now, suppose your manager wants to know whether the change you propose is really going to make a difference to the bottom line. Will investing in customer satisfaction really improve our retention, or is it just a drag on revenue? This is where having company KPIs (key performance indicators) comes in. To convince others your proposed changes are worthwhile and to rally them around your cause, it’s essential to state the problem and your solution in terms they can relate to.
Stating the impact of a problem in dollars and cents helps get people’s attention. Let’s say you’ve figured out that customers who purchase your photo editing software (segment data) are angry because it’s difficult to use (issue data). If your report shows that customer satisfaction is dropping among your software customers, your audience might assume that because your metric is affected, your team is responsible. However, if you say that customer satisfaction is dropping among your software customers who represent 20% of your recurring revenue, your audience is more likely to feel some responsibility for helping to solve the problem.
Tip 4: Record the date and time of interaction Time series analysis is essential for discovering important patterns in your data. Unless you understand the direction in which your metrics are trending, and the regularity with which they rise and fall, you’ll have a difficult time interpreting them. Even worse, you risk designing metrics that are biased and misleading.
Let’s talk patterns first: Some metrics follow a cycle. Have you ever looked at how your average daily email volume varies throughout the week? If like Zendesk, your customers are other businesses, it’s probably highest in the middle, and smallest on the weekends.
Knowing what times your workload will be largest and smallest can help you schedule enough support agents to deal with high-volume periods and scale back in low-volume periods. In the hospitality and tourism industry, for example, many businesses deal with a customer’s satisfaction cycle that plummets near the holidays, but recovers after the New Year.
What does this knowledge have to do with your metrics? When you calculate a metric, you’re taking a sample of data. You want that data sample to reflect “typical” values. It won’t do you much good to measure your email volume every day: One day isn’t long enough to estimate your typical email volume. If the cycle is a week long, however, then one week is a good unit of time to use in your metric weekly email volume.
Tip 5: Broadcast reports on a regular basis If you know what improvements you need to make, where to target them, why they’re relevant to the rest of the company, and how to distinguish normal variation in those metrics from a change worth addressing, you’ve got what you need to drive real improvement. But you can’t do it by yourself: You’ve got to use that information to make the case to colleagues that the team needs to take action.
The good news is that you don’t need to craft elaborate slide decks or make your case in front of a crowd. Simply emailing some key data points to the rest of your team can have a big impact. I met one support manager who emails a team performance scorecard to every agent. When they know their stats will be made public, agents tend to work harder (and the manager rarely has to address performance problems one-on-one). At Zendesk, support managers receive a regular snapshot of the previous week’s data. That way, there’s no need to fill everybody in at the beginning of the meeting: Everyone already knows when the data points to a problem, so they can start discussing possible solutions right away.